




















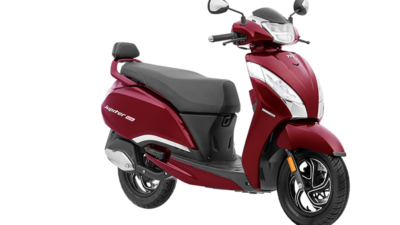
On-Road Prices by City
Every car and bike on sale, priced on the road in 39 cities: the ex-showroom price plus the state's road tax, insurance and, on cars, FASTag. Pick your city. Updated .
Read more Read less
Quick answers about on-road prices
Which city has the lowest on-road prices?
Of the 39 cities we price, on-road prices sit closest to the ex-showroom price in Surat (10.2%), Ahmedabad (10.3%), and Puducherry (10.8%), going by the middle car on sale.
Which city has the highest on-road prices?
They sit furthest above the ex-showroom price in Hyderabad (24.1%), Chennai (23.9%), and Coimbatore (23.8%).
Why does the same car cost more on the road in one city than another?
The ex-showroom price is the same across a state, but road tax is set by each state, by price band and fuel, and some add a cap or a flat levy. Insurance is priced a little higher in the eight biggest metros. Two cities in the same state differ only by that insurance zone.
-
 New Delhi
Delhi
Cars
₹3.85 Lakh
+14.0%
Bikes
₹55,816
+12.2%
-
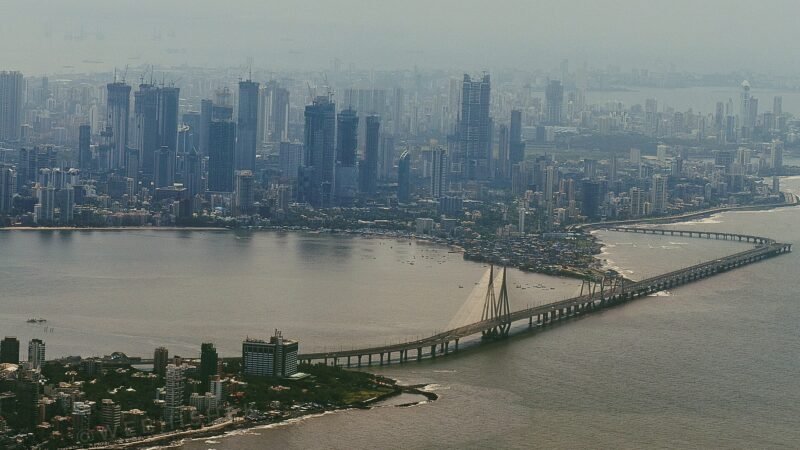 Mumbai
Maharashtra
Cars
₹4.1 Lakh
+16.7%
Bikes
₹58,229
+15.8%
-
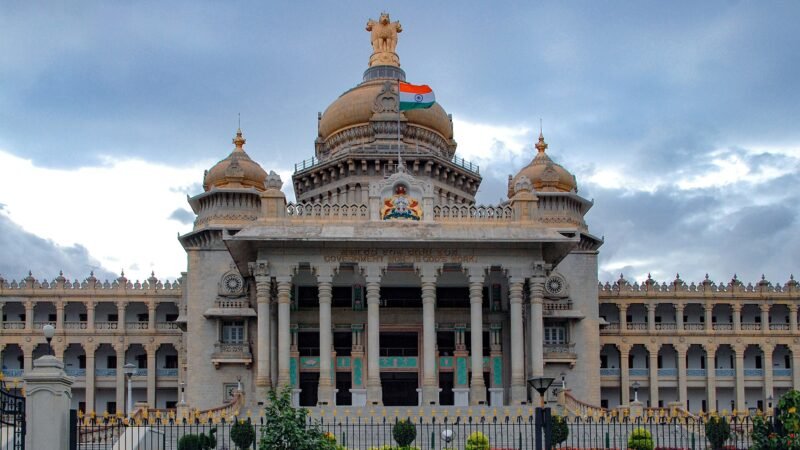 Bengaluru
Karnataka
Cars
₹4.18 Lakh
+21.9%
Bikes
₹57,746
+20.8%
-
 Hyderabad
Telangana
Cars
₹4.22 Lakh
+24.1%
Bikes
₹57,264
+20.5%
-
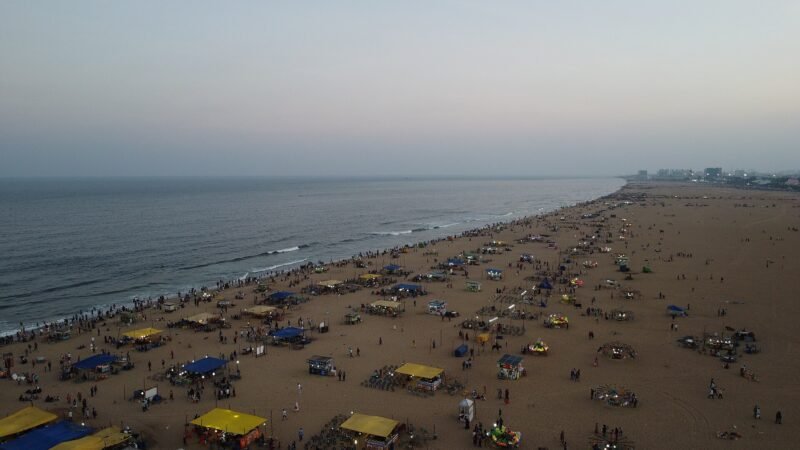 Chennai
Tamil Nadu
Cars
₹4.16 Lakh
+23.9%
Bikes
₹57,746
+16.0%
-
 Kolkata
West Bengal
Cars
₹3.9 Lakh
+13.9%
Bikes
₹57,264
+14.0%
-
 Pune
Maharashtra
Cars
₹4.1 Lakh
+16.7%
Bikes
₹58,229
+15.8%
-
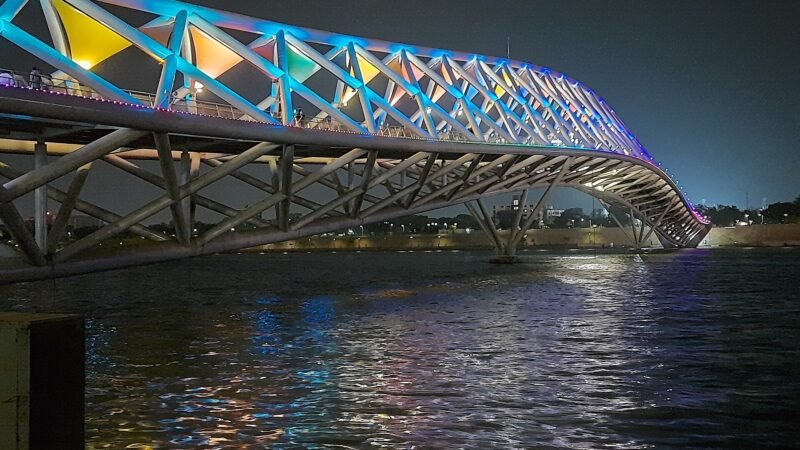 Ahmedabad
Gujarat
Cars
₹3.92 Lakh
+10.3%
Bikes
₹55,816
+10.7%
-
 Bhopal
Madhya Pradesh
Cars
₹3.99 Lakh
+17.6%
Bikes
₹56,781
+13.1%
-
 Bhubaneswar
Odisha
Cars
₹3.92 Lakh
+16.0%
Bikes
₹55,816
+12.0%
-
 Chandigarh
Cars
₹4.06 Lakh
+15.8%
Bikes
₹56,781
+14.0%
-
 Dehradun
Uttarakhand
Cars
₹4.03 Lakh
+14.0%
Bikes
₹56,781
+13.2%
-
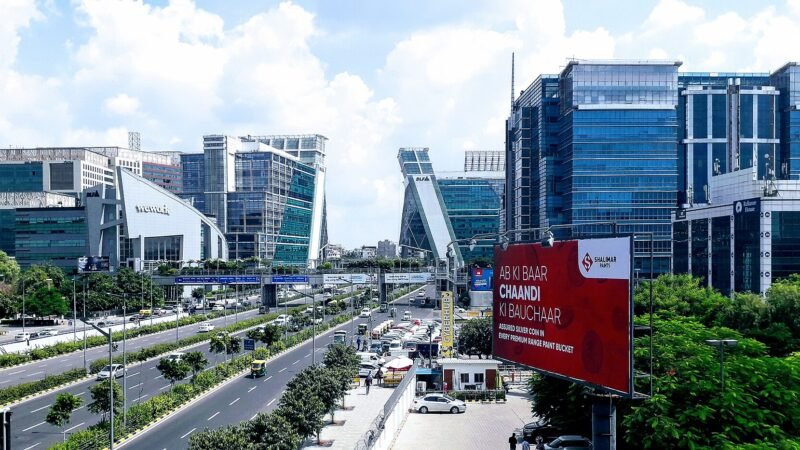 Gurugram
Haryana
Cars
₹3.88 Lakh
+13.8%
Bikes
₹54,851
+11.2%
-
 Guwahati
Assam
Cars
₹3.92 Lakh
+17.8%
Bikes
₹55,816
+13.1%
-
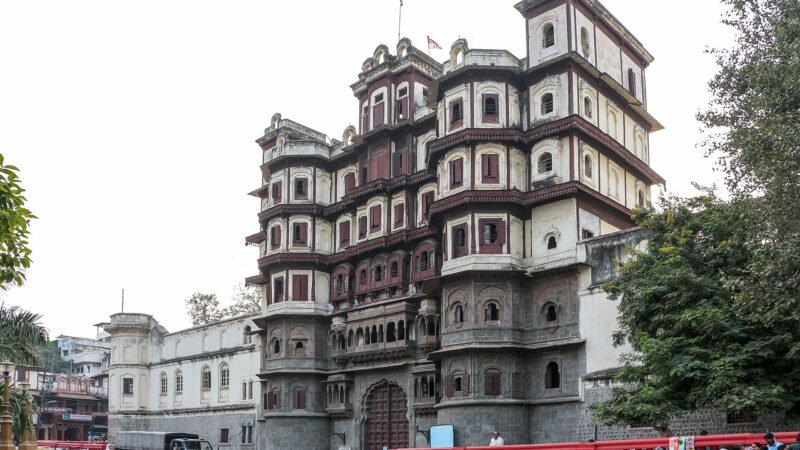 Indore
Madhya Pradesh
Cars
₹3.99 Lakh
+17.6%
Bikes
₹56,781
+13.1%
-
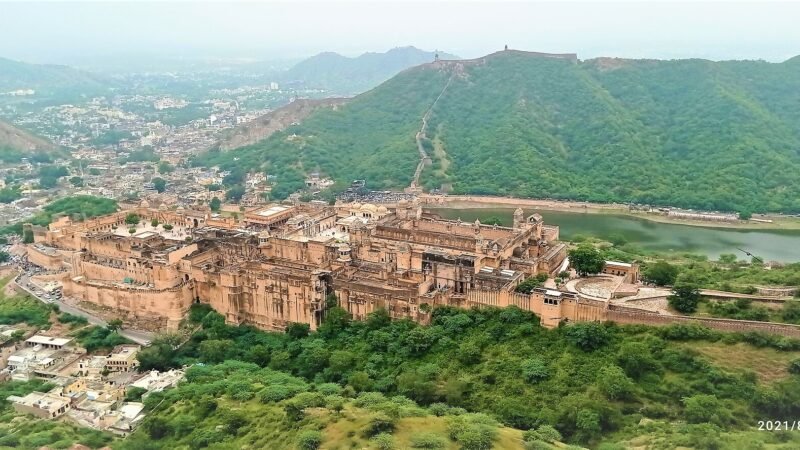 Jaipur
Rajasthan
Cars
₹4.08 Lakh
+15.3%
Bikes
₹56,781
+17.1%
-
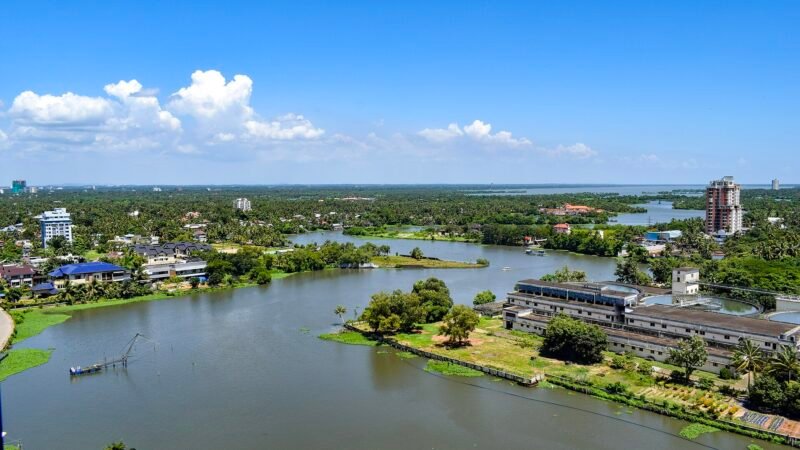 Kochi
Kerala
Cars
₹4.06 Lakh
+22.3%
Bikes
₹59,194
+23.0%
-
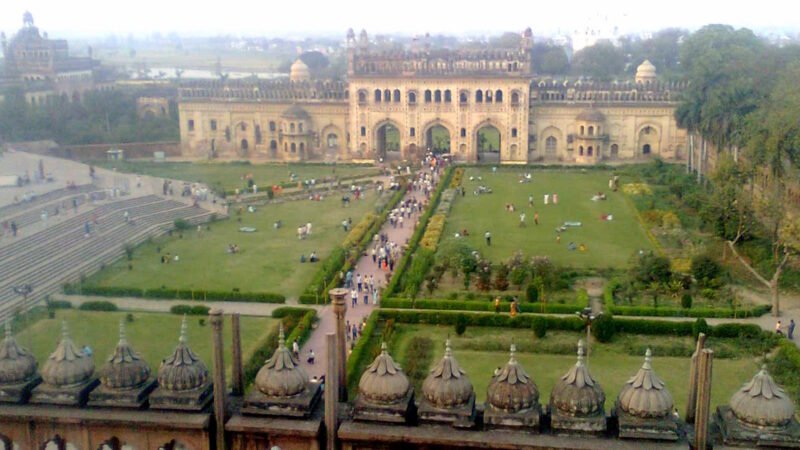 Lucknow
Uttar Pradesh
Cars
₹4.02 Lakh
+14.9%
Bikes
₹57,746
+14.2%
-
 Ludhiana
Punjab
Cars
₹4.08 Lakh
+17.8%
Bikes
₹56,540
+14.2%
-
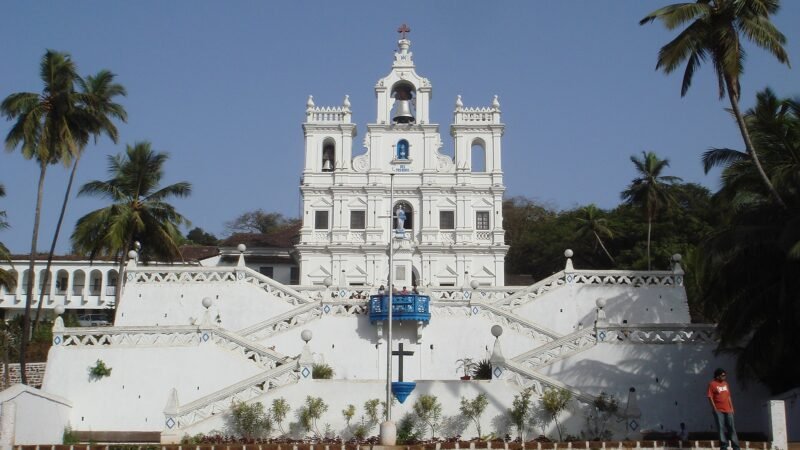 Panaji
Goa
Cars
₹4.02 Lakh
+14.4%
Bikes
₹57,264
+17.1%
-
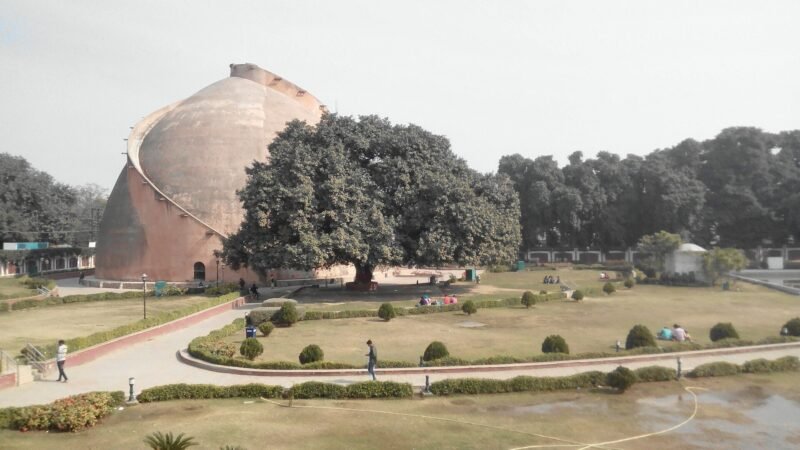 Patna
Bihar
Cars
₹4.02 Lakh
+15.9%
Bikes
₹56,781
+14.2%
-
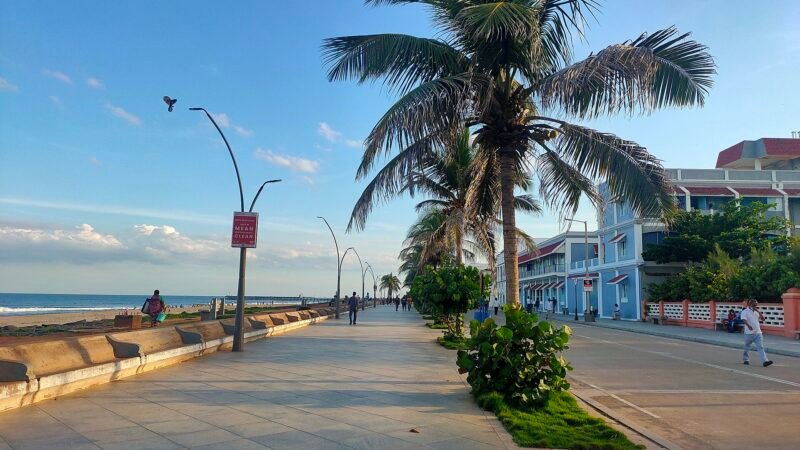 Puducherry
Cars
₹3.85 Lakh
+10.8%
Bikes
₹53,886
+8.3%
-
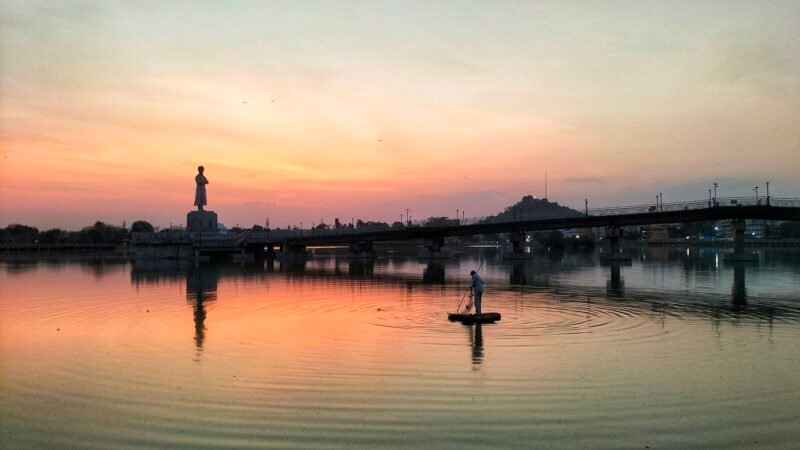 Ranchi
Jharkhand
Cars
₹4.02 Lakh
+13.0%
Bikes
₹56,299
+13.1%
-
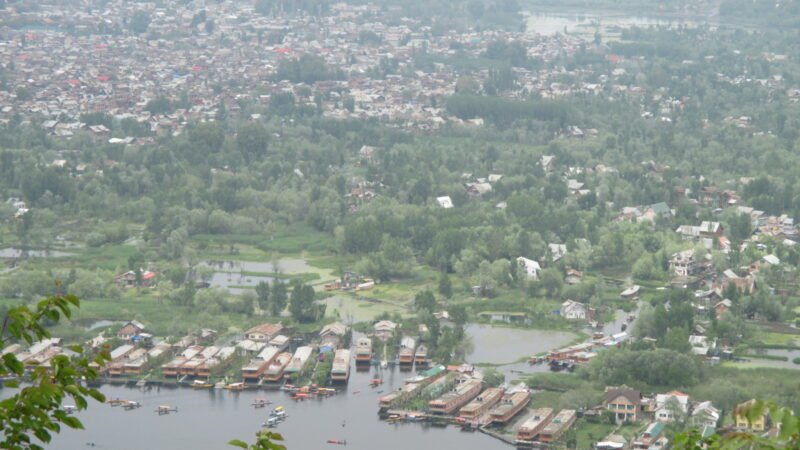 Srinagar
Jammu and Kashmir
Cars
₹4.02 Lakh
+13.0%
Bikes
₹57,264
+13.9%
-
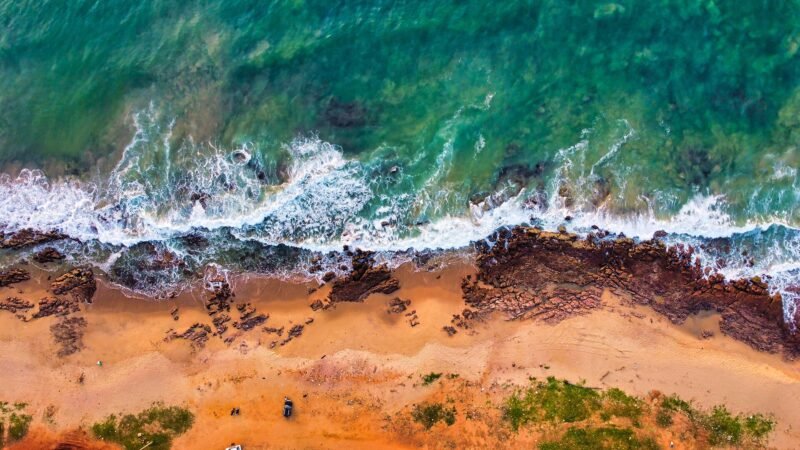 Visakhapatnam
Andhra Pradesh
Cars
₹4.21 Lakh
+23.6%
Bikes
₹59,290
+17.4%
-
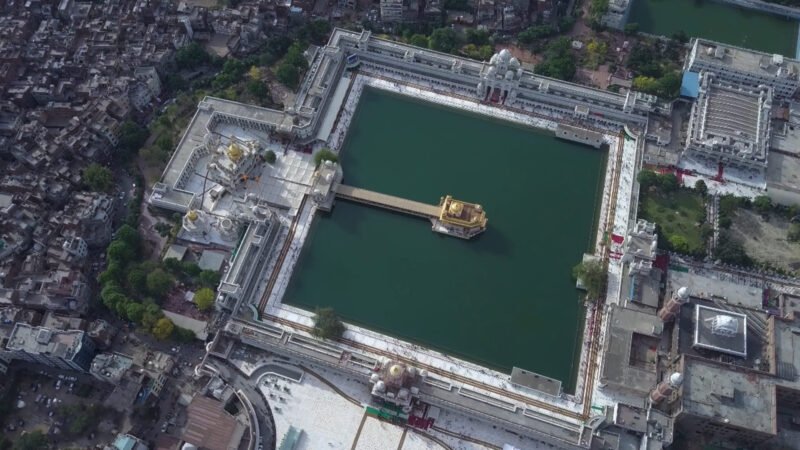 Amritsar
Punjab
Cars
₹4.08 Lakh
+17.8%
Bikes
₹56,540
+14.2%
-
 Coimbatore
Tamil Nadu
Cars
₹4.15 Lakh
+23.8%
Bikes
₹57,746
+16.0%
-
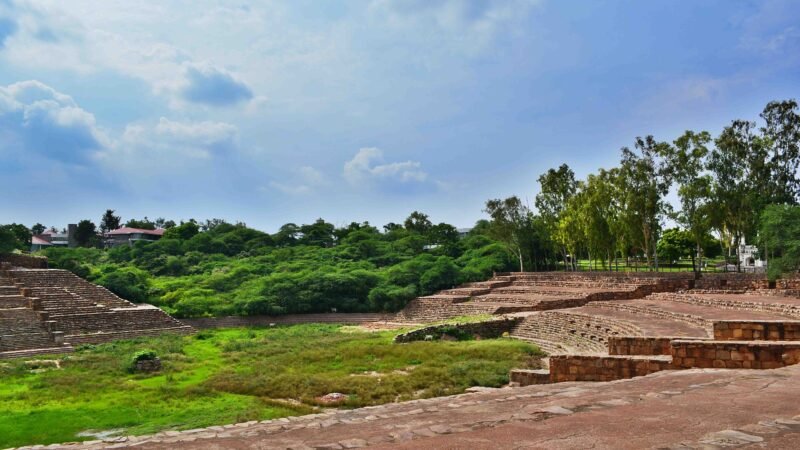 Faridabad
Haryana
Cars
₹3.88 Lakh
+13.8%
Bikes
₹54,851
+11.2%
-
 Jammu
Jammu and Kashmir
Cars
₹4.02 Lakh
+13.0%
Bikes
₹57,264
+13.9%
-
 Jodhpur
Rajasthan
Cars
₹4.08 Lakh
+15.3%
Bikes
₹56,781
+17.1%
-
 Kanpur
Uttar Pradesh
Cars
₹4.02 Lakh
+14.9%
Bikes
₹57,746
+14.2%
-
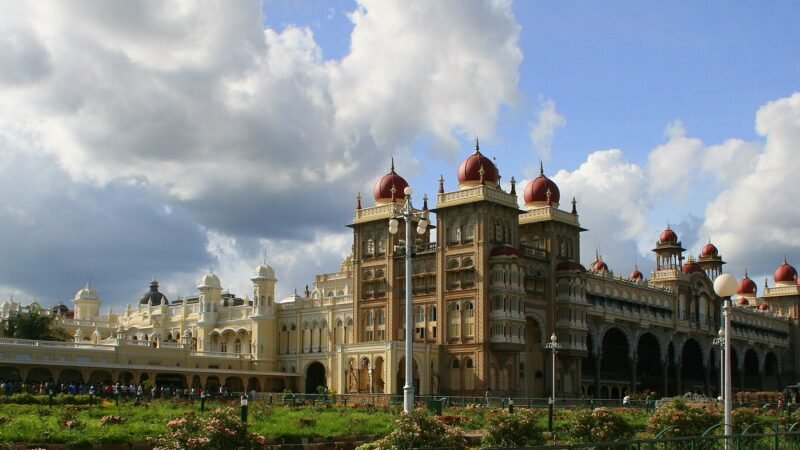 Mysuru
Karnataka
Cars
₹4.17 Lakh
+21.8%
Bikes
₹57,746
+20.8%
-
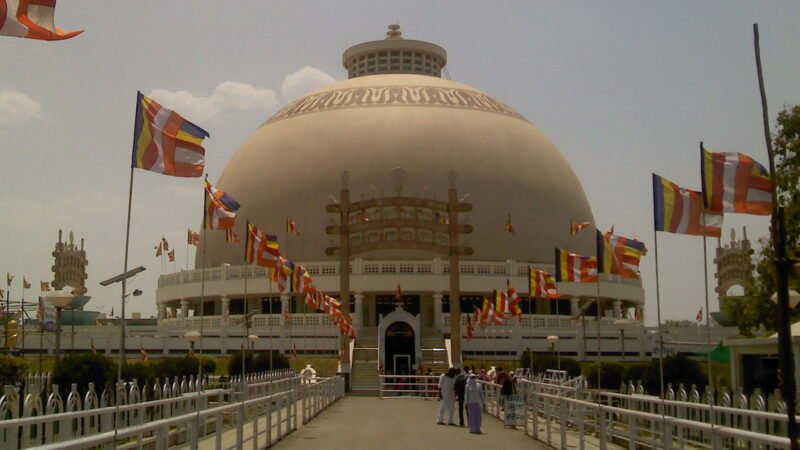 Nagpur
Maharashtra
Cars
₹4.09 Lakh
+16.6%
Bikes
₹58,229
+15.8%
-
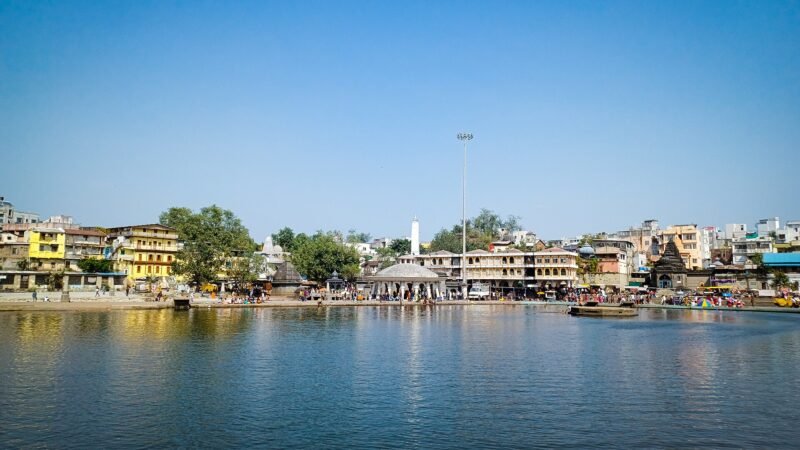 Nashik
Maharashtra
Cars
₹4.09 Lakh
+16.6%
Bikes
₹58,229
+15.8%
-
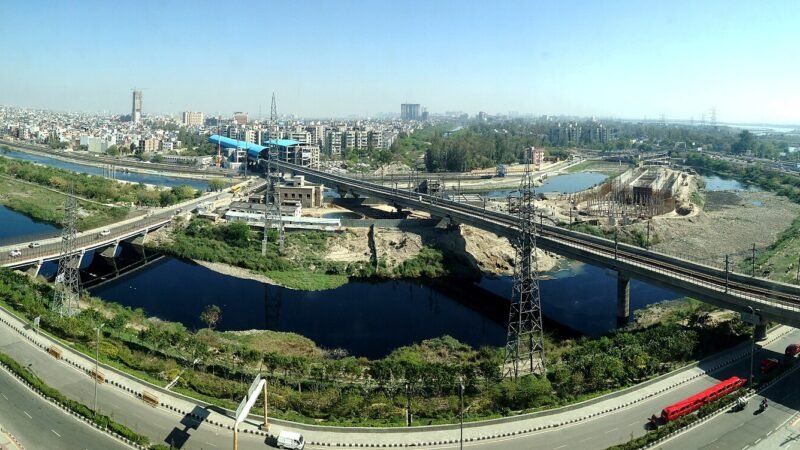 Noida
Uttar Pradesh
Cars
₹4.02 Lakh
+14.9%
Bikes
₹57,746
+14.2%
-
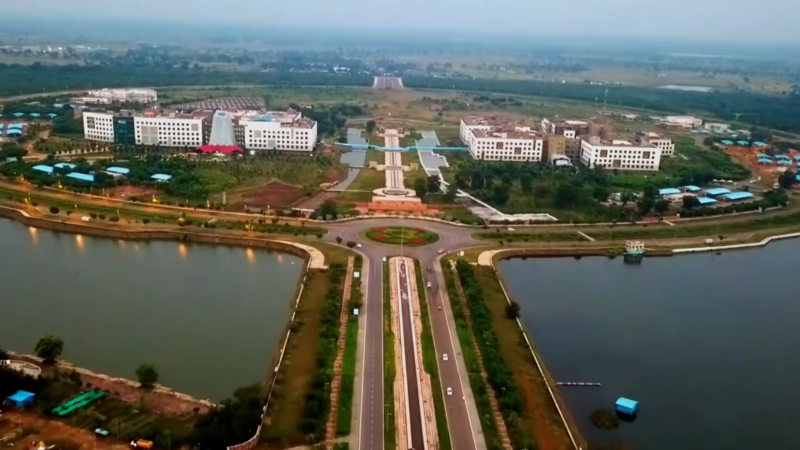 Raipur
Chhattisgarh
Cars
₹3.99 Lakh
+13.0%
Bikes
₹56,781
+12.4%
-
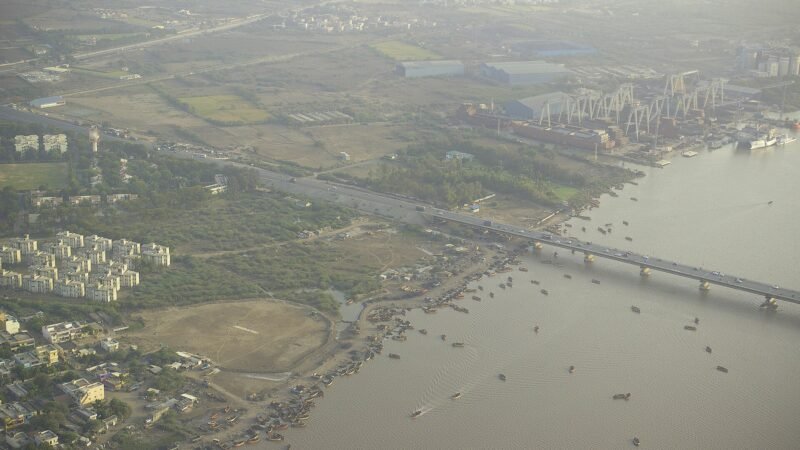 Surat
Gujarat
Cars
₹3.92 Lakh
+10.2%
Bikes
₹55,816
+10.7%
-
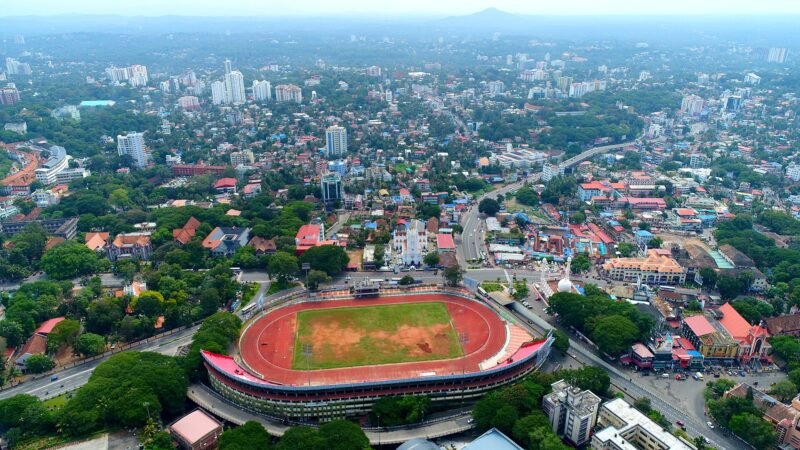 Thiruvananthapuram
Kerala
Cars
₹4.06 Lakh
+22.3%
Bikes
₹59,194
+23.0%
-
 Vijayawada
Andhra Pradesh
Cars
₹4.21 Lakh
+23.6%
Bikes
₹59,290
+17.4%
Where cars and bikes cost least on the road
How far the middle car, and the middle bike or scooter, on sale costs above its ex-showroom price once road tax, insurance and, on cars, FASTag are paid. Cities run from the lowest to the highest, taking cars and bikes together.
All of India
Pick a state to see its cities, or a pin to open that city's prices.
Map: DataMeet India community, CC BY 4.0, simplified.
Estimates. Actual road tax, insurance and accessory costs vary by dealer, insurer and the latest government notification, so confirm the final on-road price with your dealer before booking.
Photo credits
City photos from Wikimedia Commons, cropped and resized.
- New Delhi: Aerial view of Central Vista, New Delhi , India, Narendra Modi YouTube Channel, Government of India, CC BY-SA 4.0
- Mumbai: Mumbai and Bandra-Worli Sea Link, webhishek, CC BY 2.0
- Bengaluru: Vidhana Soudha, front (01), Moheen Reeyad, CC BY-SA 4.0
- Hyderabad: Aerial view of Charminar (closeup), iMahesh, CC BY-SA 4.0
- Chennai: Marina beach, Chennai aerial view, Saiphani02, CC BY-SA 4.0
- Kolkata: Aerial view of Kolkata 10, Indrajit Das, CC BY-SA 4.0
- Pune: The entrance of Shaniwar Wada., Aakash.gautam, CC BY-SA 3.0
- Ahmedabad: Sabarmati riverfront and Atal Pedestrian Bridge 06, Pravega, CC0
- Bhopal: Aerial view of Upper Lake, Bhopal, Bilal Nibraas, CC BY-SA 4.0
- Bhubaneswar: Aerial view of Bhubaneswar Centre, Government of Odisha, CC BY 4.0
- Chandigarh: Open Hand monument, Chandigarh, Raakesh Blokhra, CC BY-SA 2.0
- Dehradun: Forest Research Institute campus, Dehradun, India, Torarne, CC BY-SA 4.0
- Gurugram: Cyber City View, Tarun4u, CC BY-SA 4.0
- Guwahati: Guwahati, Longest Flyover, Inaugurated, Panoramic View, Maligaon Area, Prof. Vikramjit Kakati, CC BY-SA 4.0
- Indore: Rajwada Palace, Indore, Bernard Gagnon, CC BY-SA 3.0
- Jaipur: Beauty of Amer Fort, Sarimbey0210, CC BY-SA 4.0
- Kochi: Cityscape - View From The Crowne Plaza - Kochi 2026-09-04 5327, Galib Tufan, CC BY-SA 4.0
- Lucknow: Aerial View Imaam baara, Prateek1961, CC BY-SA 4.0
- Ludhiana: Ludhiana skyline, Benison P Baby, CC BY-SA 4.0
- Panaji: Kostel Naší Paní Neposkvrněného početí, Panadží, Ondřej Žváček, CC BY 2.5
- Patna: Golghar patna Bihar India, Deepak1408, CC BY-SA 4.0
- Puducherry: Pondicherry Beach view, Athulvis, CC BY-SA 4.0
- Ranchi: Ranchi lake, Shubjt, CC BY-SA 4.0
- Srinagar: Aerial view of the Dal Lake of Sri Nagar, Billjones94, CC BY-SA 4.0
- Visakhapatnam: Aerial view of Rushikonda beach, iMahesh, CC BY-SA 4.0
- Amritsar: Golden temple aerial shot in Amritsar, Daniel Romanson, CC0
- Coimbatore: Adiyogi Shiva steel burst 2018, Prabhuthiru57, CC BY-SA 4.0
- Faridabad: Suraj Kund Masonary 019, Anupamg, CC BY-SA 4.0
- Jammu: Bahu Fort, Jammu, Vedant Sharma, CC BY-SA 4.0
- Jodhpur: Mehrangrah Fort and Jaswant Thada in blue city of Jodhpur, Saket Verma, CC BY-SA 4.0
- Kanpur: JK Temple(Juggilal Kamlapati temple) is a temple in the Indian city of Kanpur.It is considered to be a unique blend of ancient and modern architecture, Udayraj18, CC BY-SA 4.0
- Mysuru: Mysore Palace (1), Hari R, CC BY 2.0
- Nagpur: Deekshabhoomi - panoramio, Ganesh Dhamodkar, CC BY 3.0
- Nashik: Gandhi Talav Godavari Nashik Maharashtra, MayurFreelancer, CC BY-SA 4.0
- Noida: View of Noida city from the Hilton Noida, Edmund Gall, CC BY-SA 2.0
- Raipur: Naya Raipur, Sector 19, VishuN, CC BY-SA 4.0
- Surat: Surat Aerial View, Rahul Bhadane, CC BY-SA 4.0
- Thiruvananthapuram: Aerial view Towards Chandrasekharan Nair Stadium, Aswanth Mohan, CC BY-SA 4.0
- Vijayawada: Indrakeeladri and Prakasam Barrage from Tadepalli (01), iMahesh, CC BY-SA 4.0